This post is another in the series about running hosting on a VPS instead of a cloud provider. If you’re just joining us, you might want to check out the previous posts in the series: Expensive Hosting for Small to Medium Projects and Server Setup.
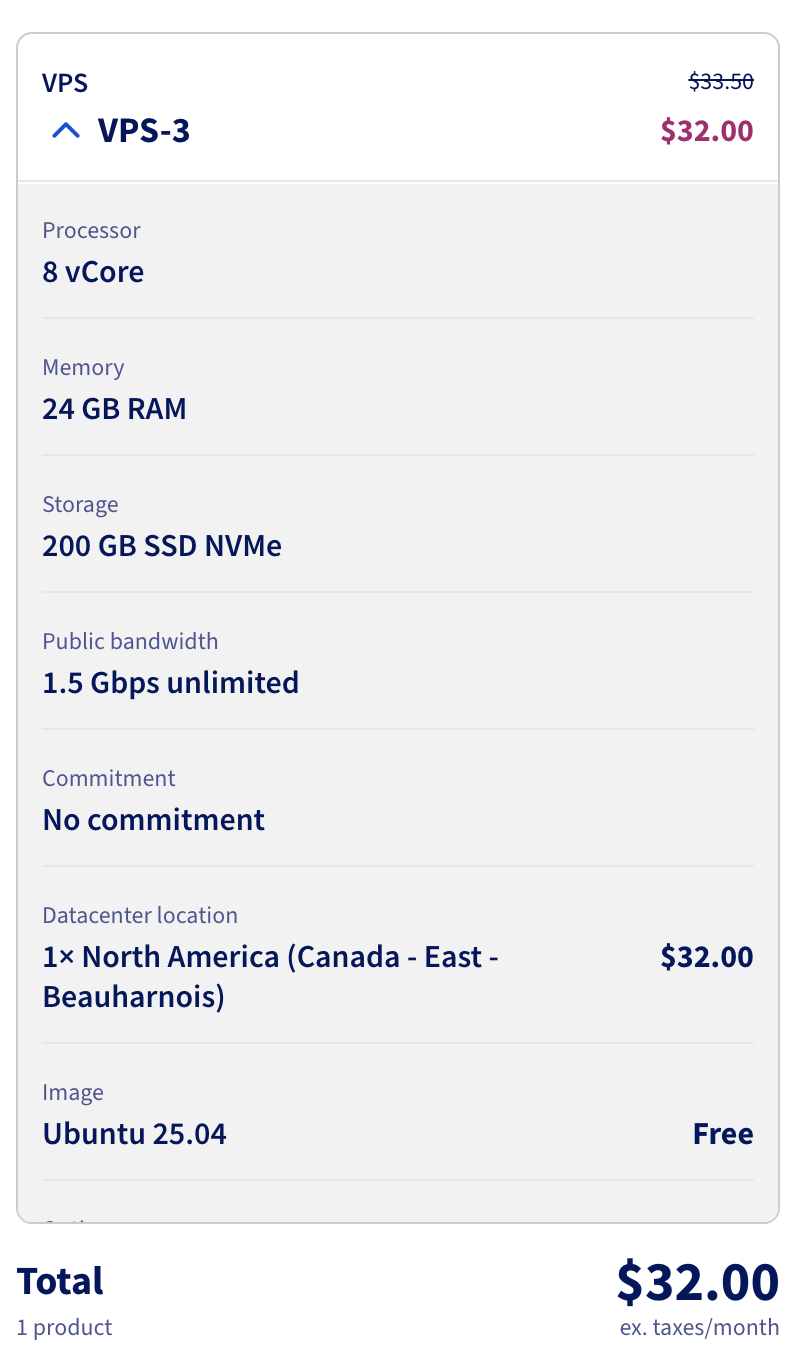
Now we’re spending about $30 a month for this server and I want to see how it performs relative to a database provisioned in Azure. To do that I’m going to run pgbench against a PostgreSQL database running on this VPS and then compare it to the same test run against a PostgreSQL database provisioned in Azure.
The docs for pgbench describe it as
gbench is a simple program for running benchmark tests on PostgreSQL. It runs the same sequence of SQL commands over and over, possibly in multiple concurrent database sessions, and then calculates the average transaction rate (transactions per second). By default, pgbench tests a scenario that is loosely based on TPC-B, involving five SELECT, UPDATE, and INSERT commands per transaction. However, it is easy to test other cases by writing your own transaction script files.
So this should be a consistent way to compare the performance of the database compared to an Azure one.
We’re going to run with
pgbench -i -s 50 benchmarkdb
pgbench -c 100 -j 10 -T 300 -M prepared -r -P 10 benchmarkdb
This will intiate a benchmark with a scale factor of 50, which means it will create 50 tables with 100,000 rows each. Then it will run the benchmark with 100 clients, 10 threads, for a duration of 300 seconds, using prepared statements. It will also report progress every 10 seconds. On the VPS I also ran
sudo -u postgres createdb benchmarkdb
To create the database for the benchmark and set a bunch of PG environment variables to goven the connection to the database.
This landed us with a result of
transaction type: <builtin: TPC-B (sort of)>
scaling factor: 50
query mode: prepared
number of clients: 100
number of threads: 10
maximum number of tries: 1
duration: 300 s
number of transactions actually processed: 2062685
number of failed transactions: 0 (0.000%)
latency average = 14.525 ms
latency stddev = 8.738 ms
initial connection time = 252.050 ms
tps = 6879.885154 (without initial connection time)
I don’t know if that’s a good score or not but it is a number. Next up we’ll provision a database in Azure and run the same test to see how it compares.
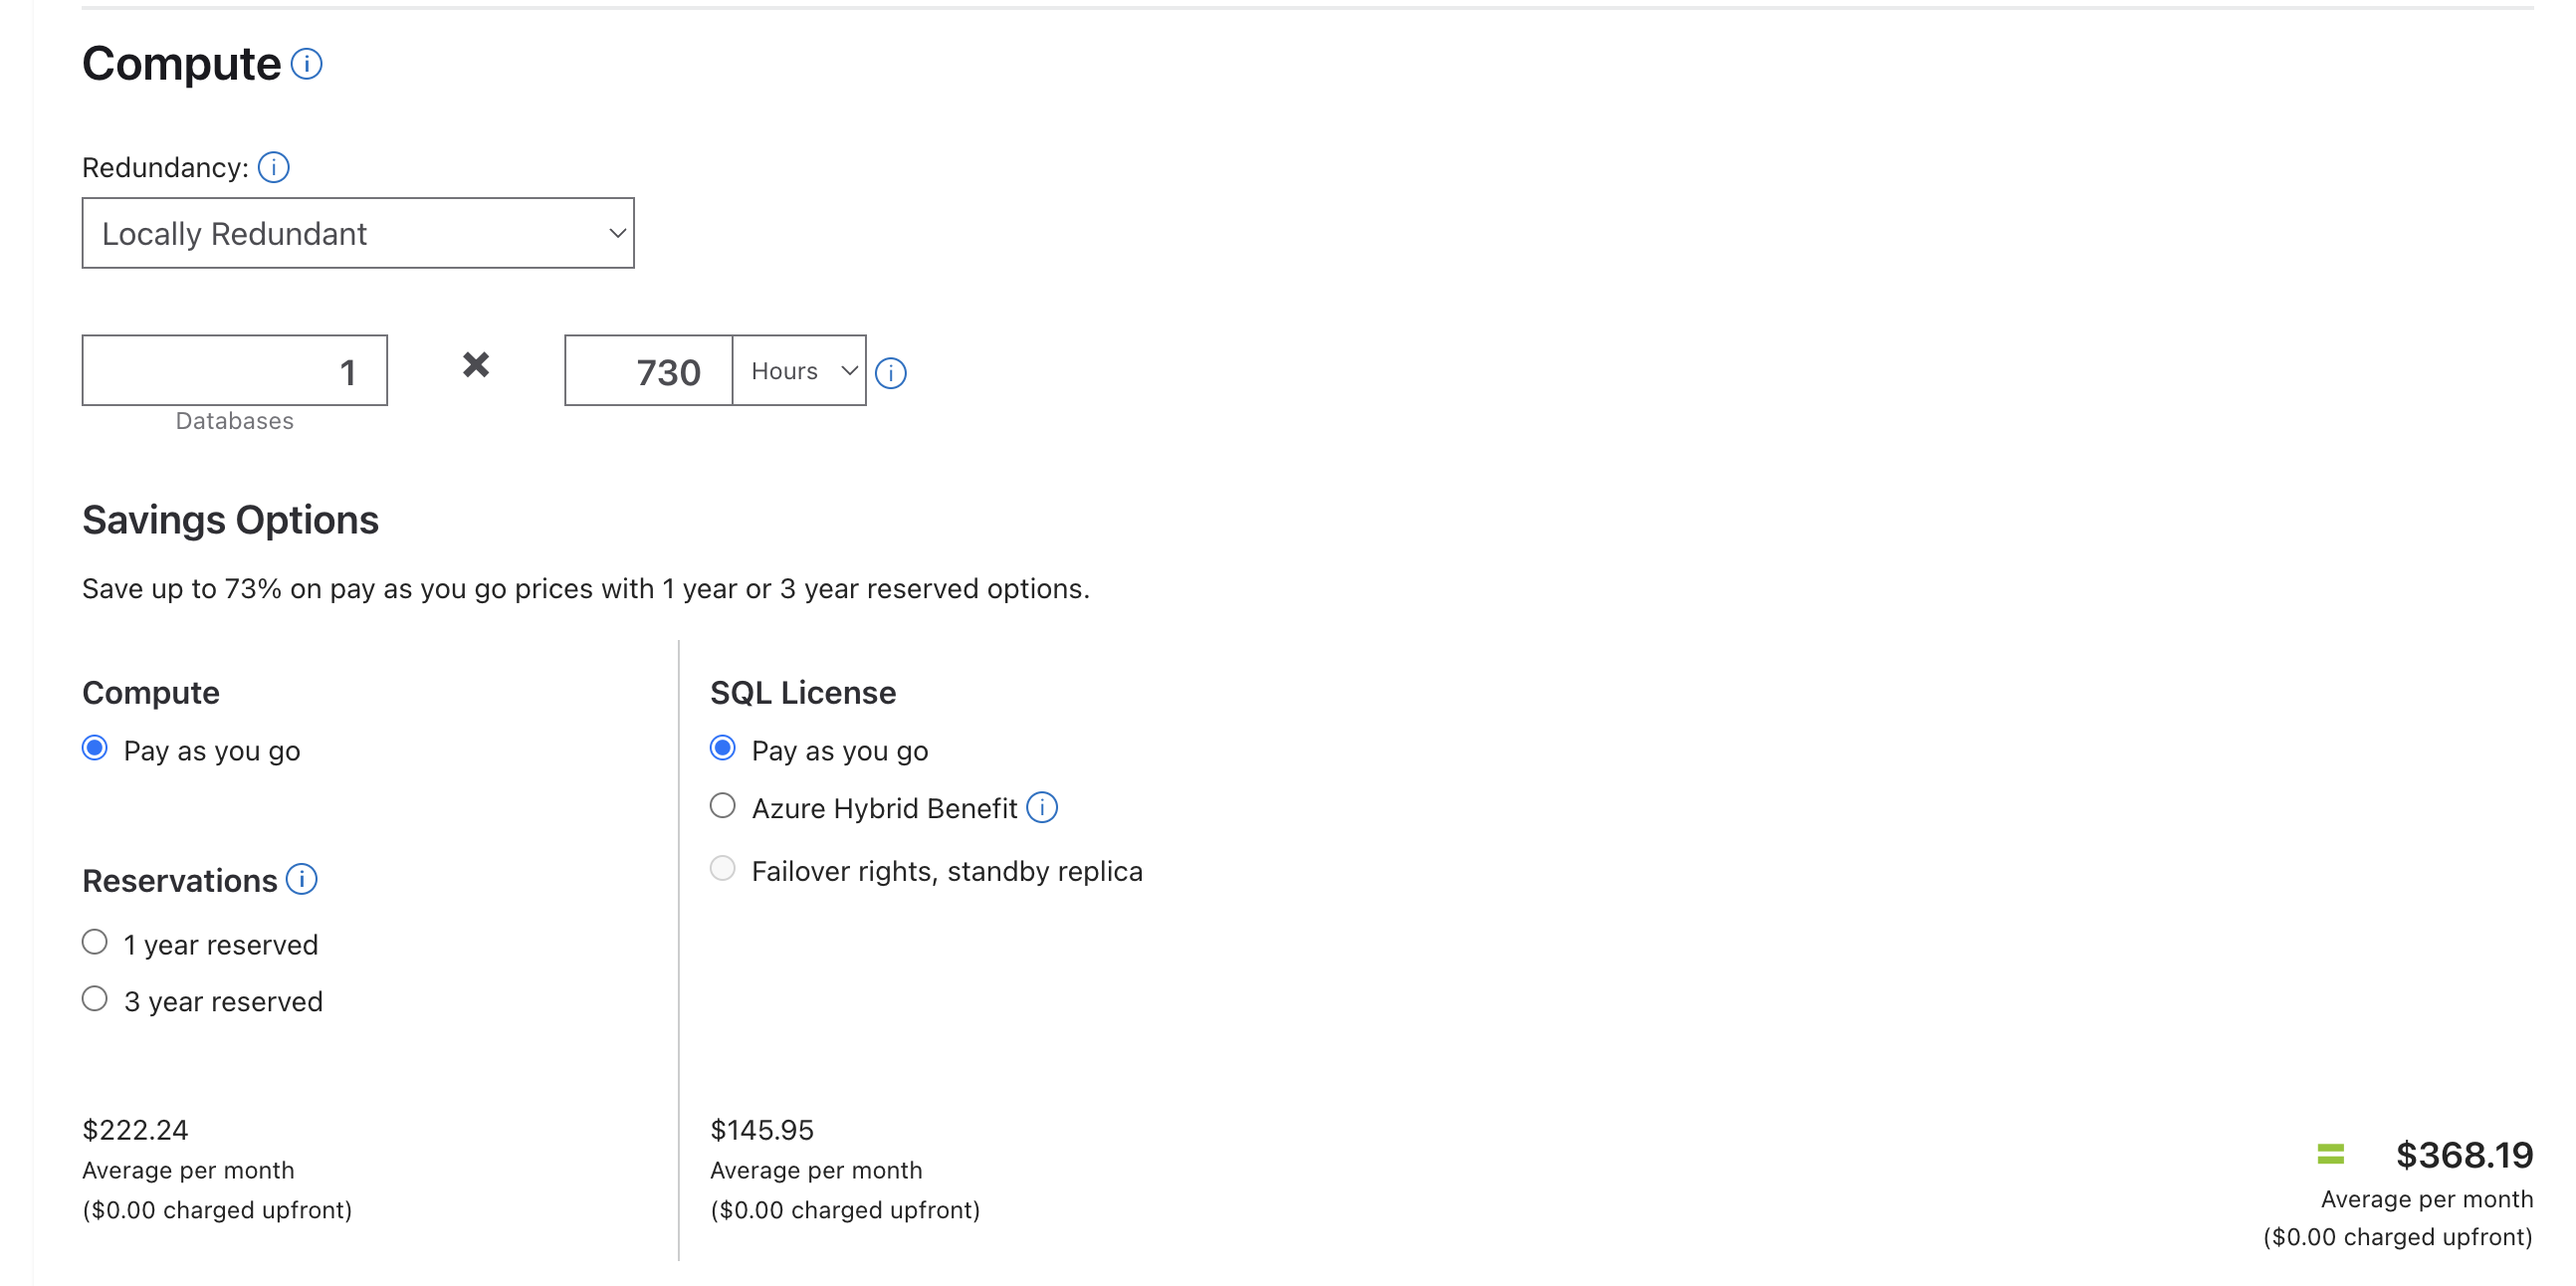
I went to provision the server on azure and got this great search result.
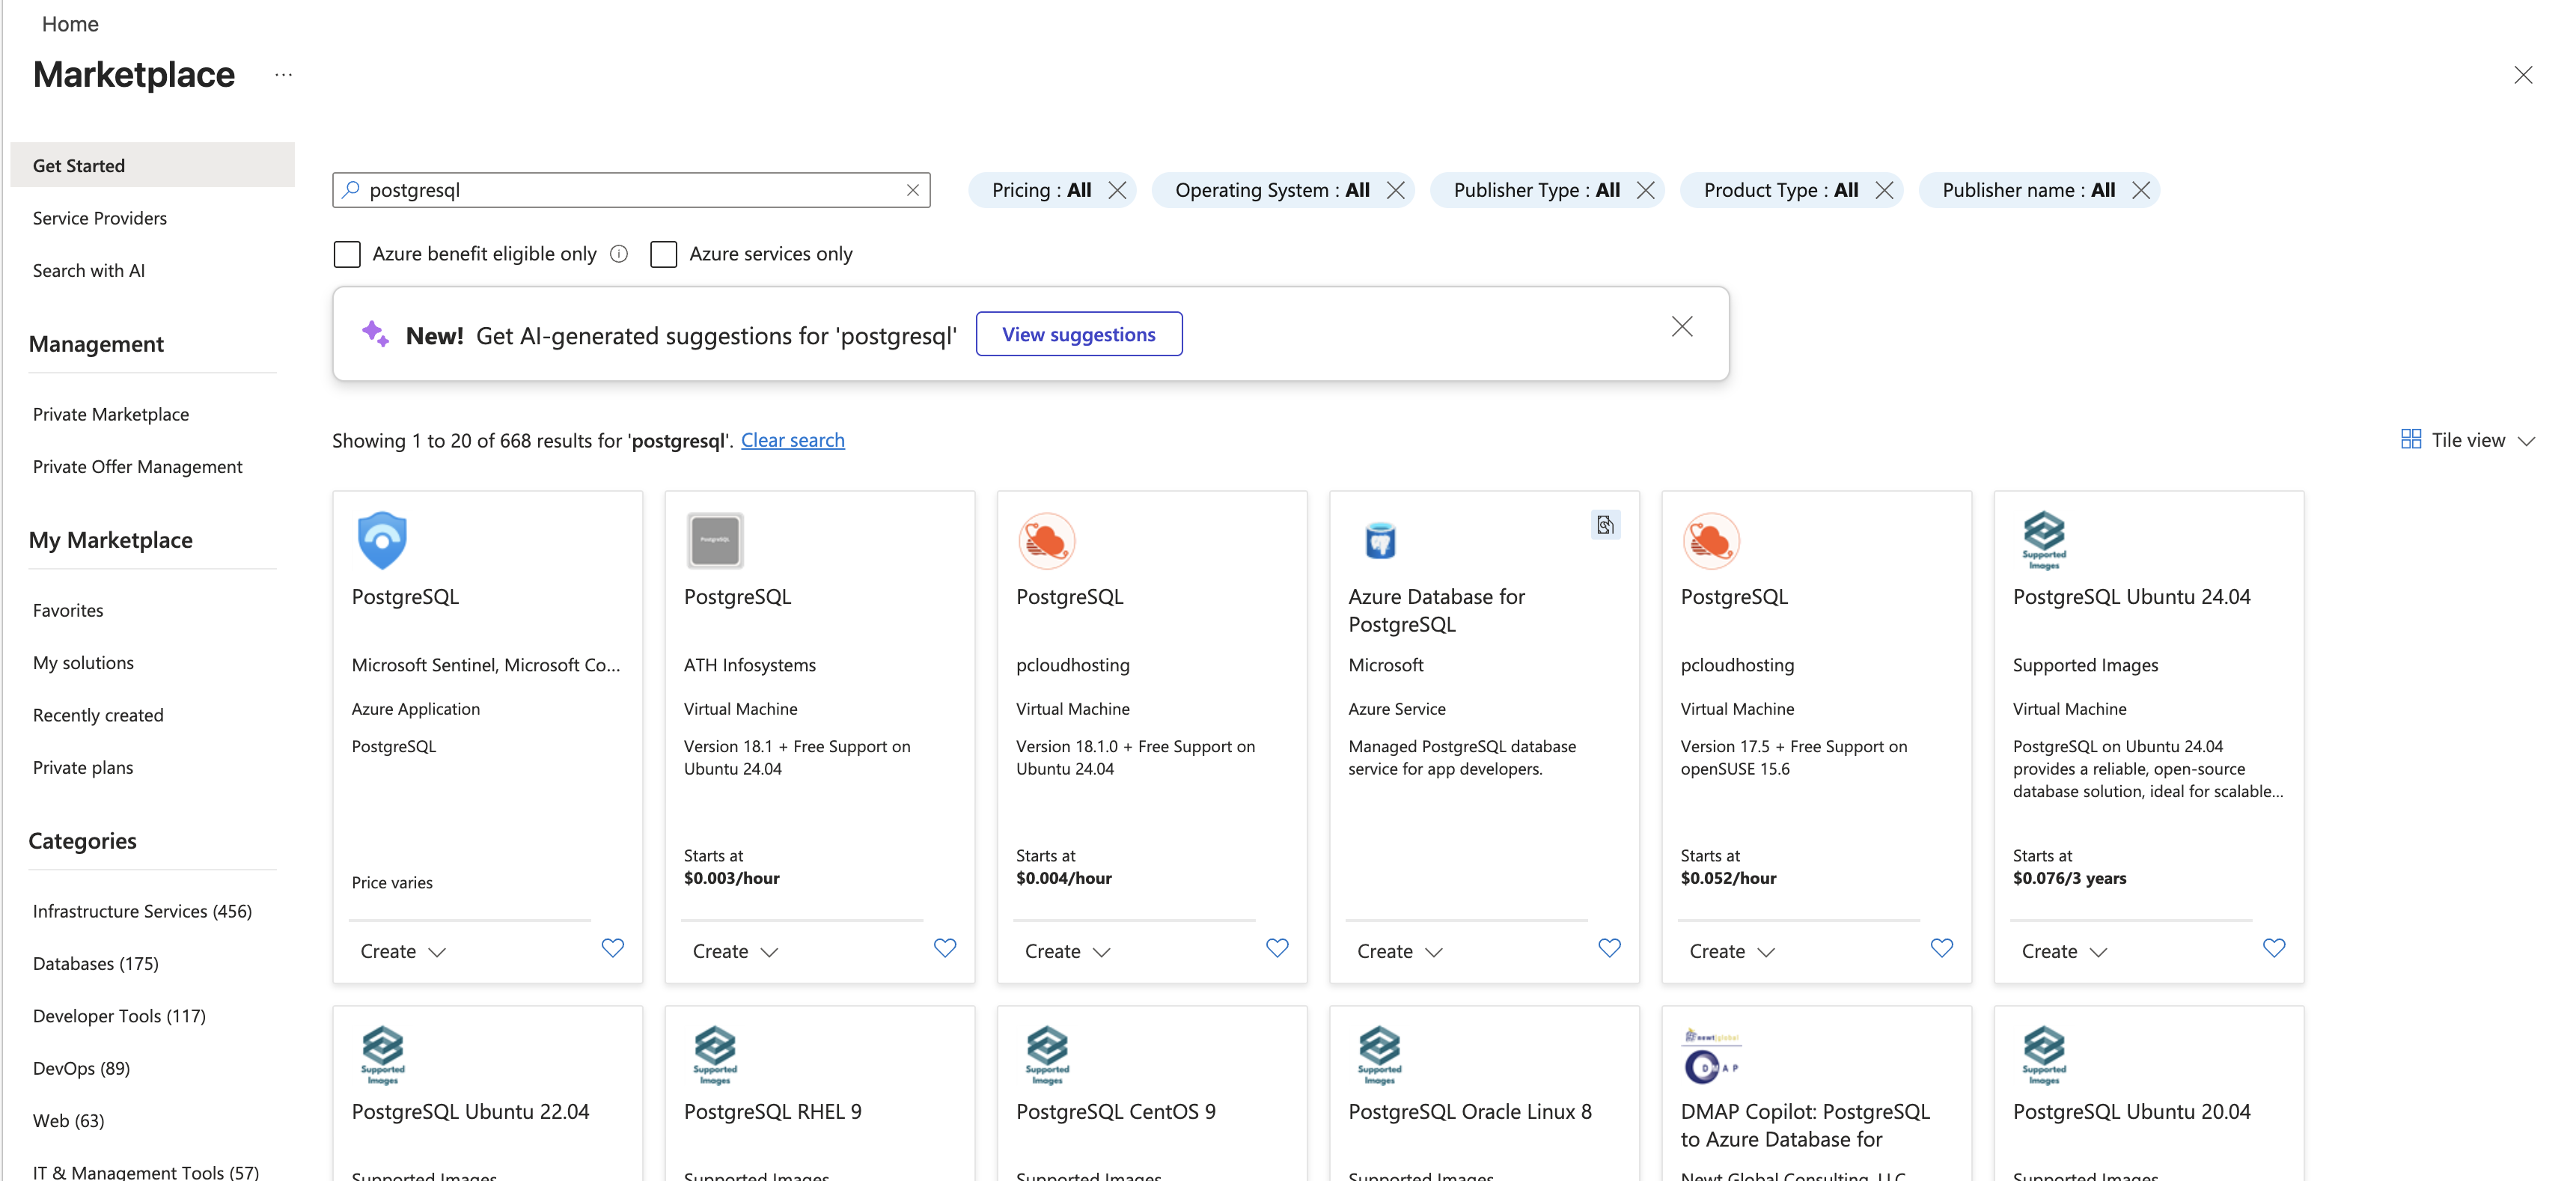
We actually want the 4th thing on that list, which I think really adds to the confusion of running anything on Azure. The way they manage their marketplace is so weird but I suppose they are selling underlying compute and don’t really care how you use it so long as you use lots of it.
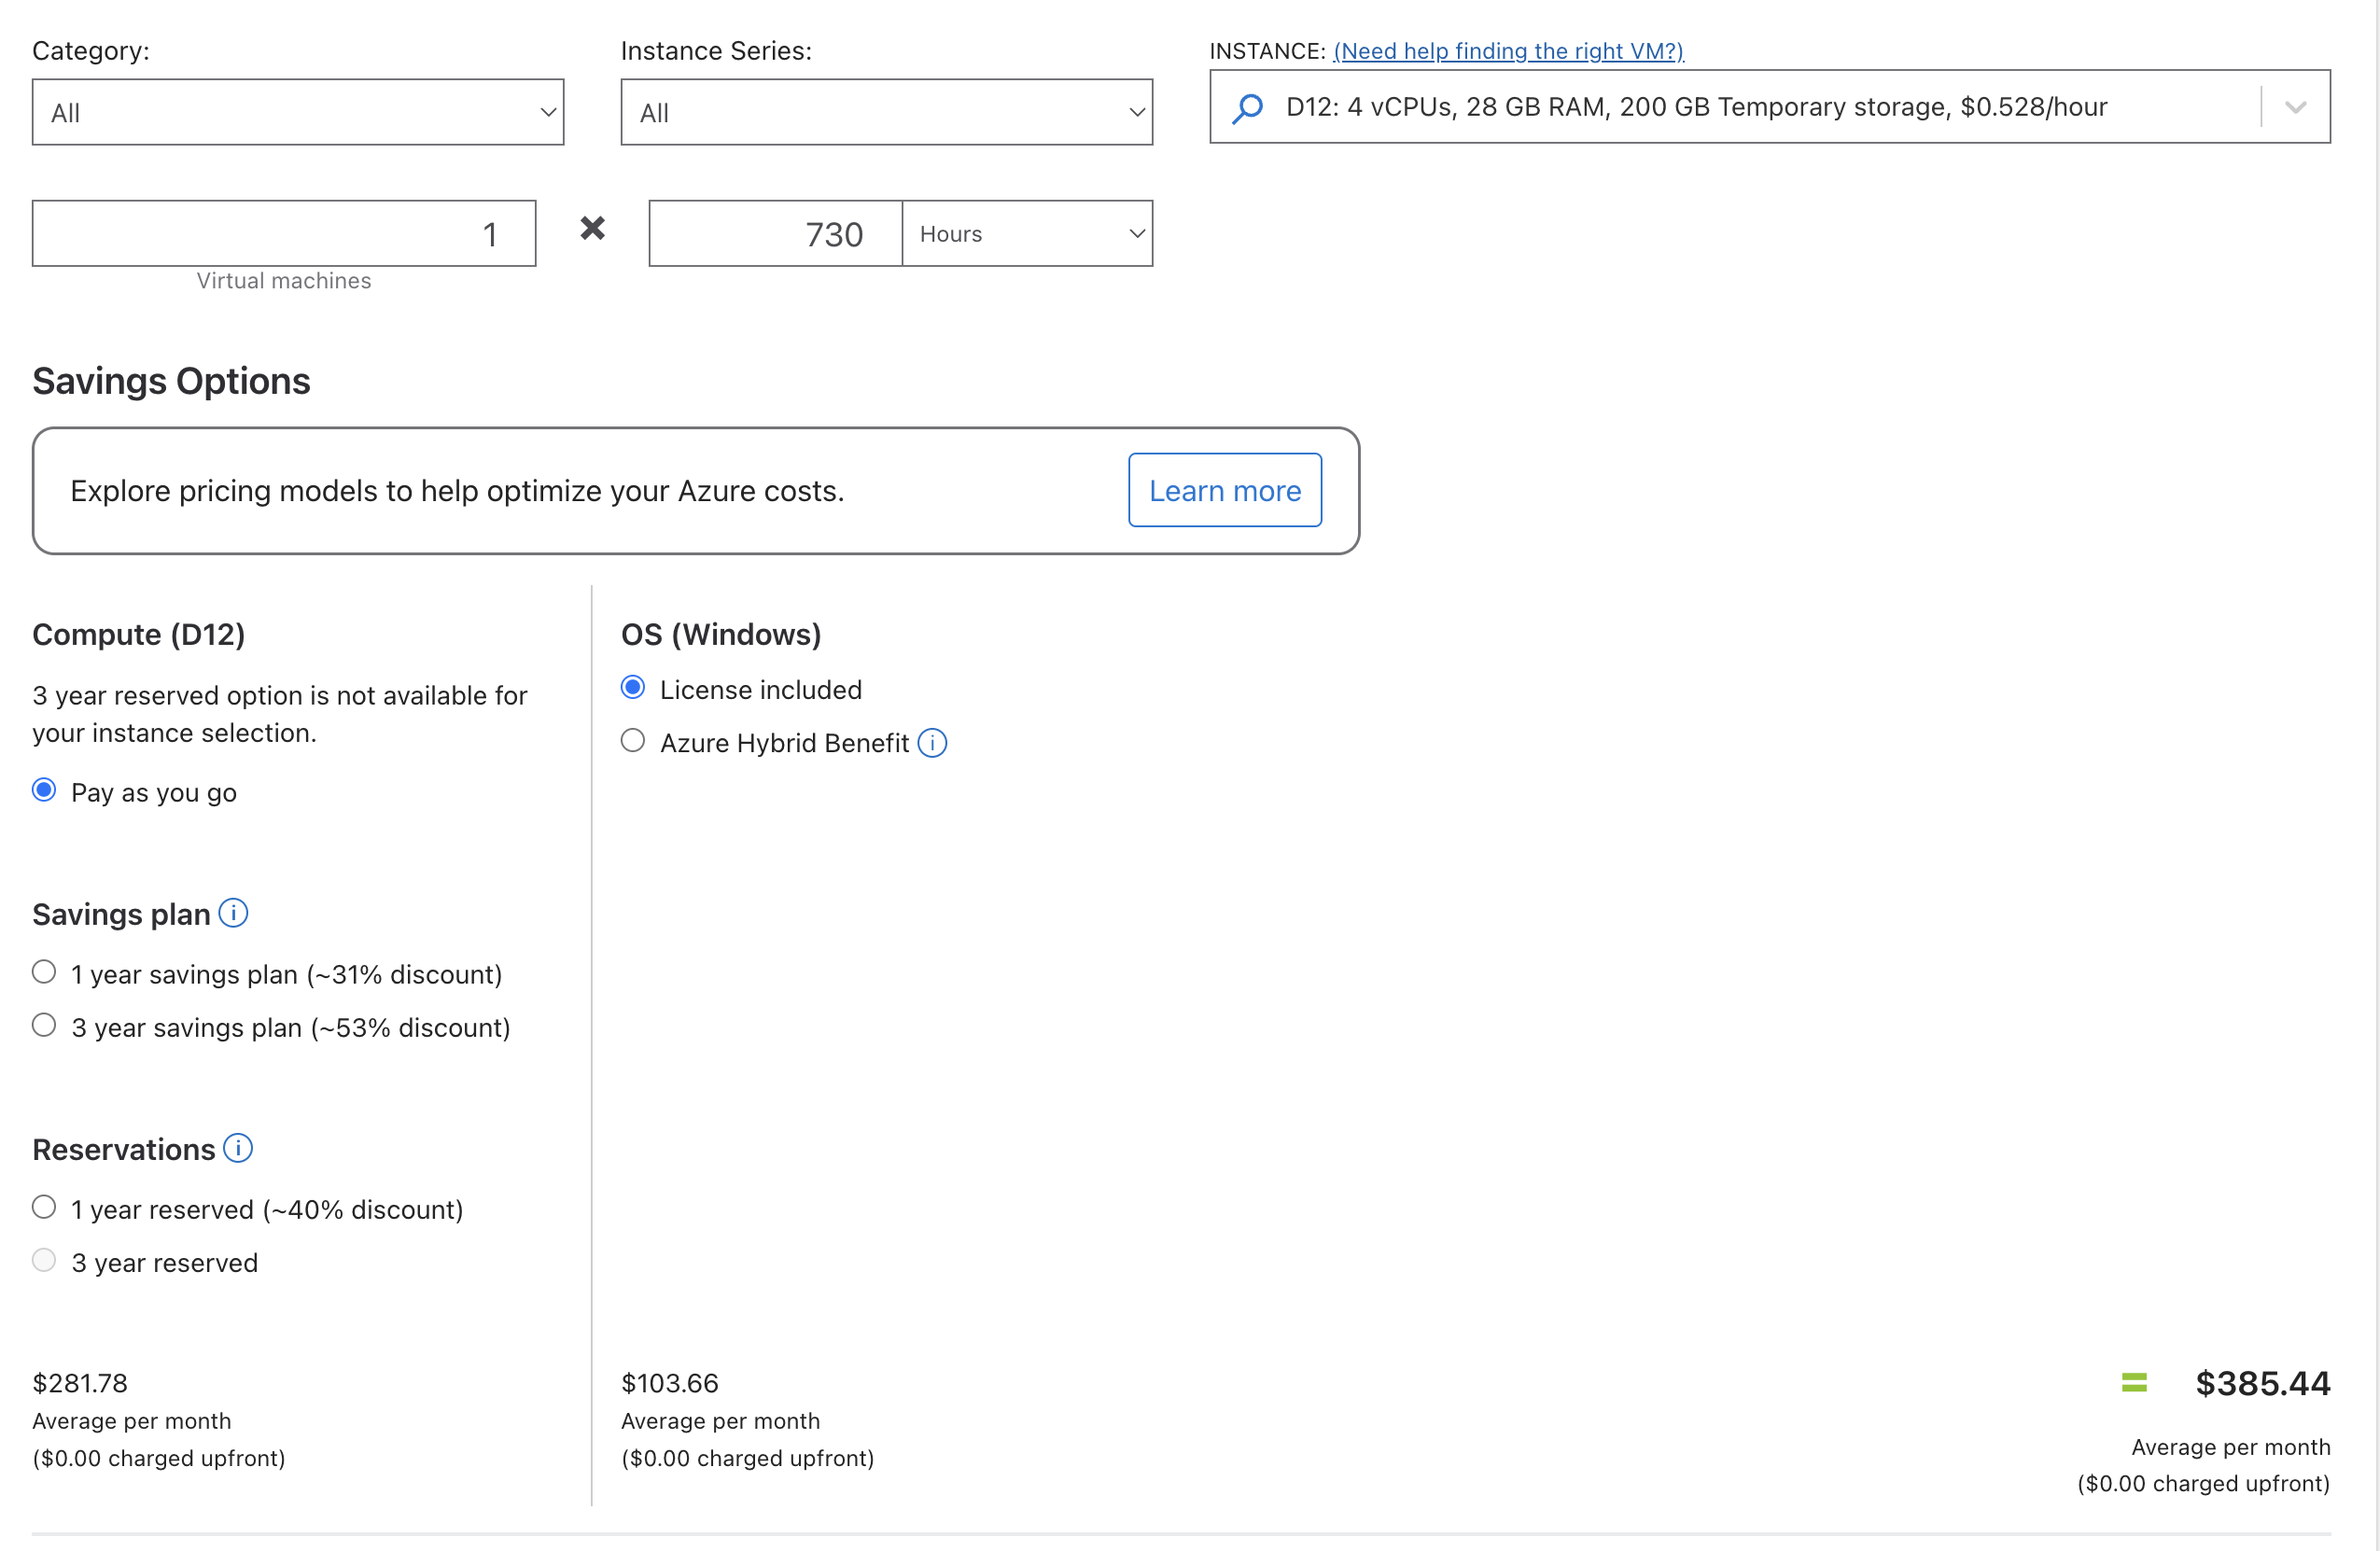
It is hard to figure out which tier to provision but I started with a Standard_D4ds_v5 which has 4 vCores and 16 GB of memory. This is a bit less memory than the VPS and half as many cores. It should give us starting point for comparison. The cost of this server with Premium SSD is USD 585.12/month or about $800 Canadian. This is about 25x the cost of the VPS so if we get similar performance then the VPS is a clear winner.
transaction type: <builtin: TPC-B (sort of)>
scaling factor: 50
query mode: prepared
number of clients: 100
number of threads: 10
maximum number of tries: 1
duration: 300 s
number of transactions actually processed: 383723
number of failed transactions: 0 (0.000%)
latency average = 77.774 ms
latency stddev = 25.866 ms
initial connection time = 1556.710 ms
tps = 1285.070570 (without initial connection time)
Oh.
So the Azure database is 1/5th the performance of the VPS database and costs 25x as much. This is a pretty clear win for the VPS. I wanted to see where we’d have to land to get the same performance as the VPS so I started scaling up the Azure database.
| Server |
TPS |
Cost (CAD/month) |
TPS/Dollar/Month |
| VPS |
6879.885154 |
32 |
215.621423 |
| Azure Standard_D4ds_v5 |
1285.070570 |
800 |
1.606338 |
| Azure Standard_D8ds_v5 |
1344.543153 |
1613 |
|
0.833 |
How interesting, doubling the cores and memory on Azure only got us a 5% increase in performance. This is a pretty clear indication that the bottleneck is not the compute but something else. I suspect it is the storage, which is not surprising given that the VPS is using an NVMe SSD and the Azure database is using a Premium SSD which is not nearly as fast.
So I scaled back down to a Standard_D4ds_v5 and switched from performance tier P4 (120IOPS) to P15 (7500 IOPS) and got this result.
transaction type: <builtin: TPC-B (sort of)>
scaling factor: 50
query mode: prepared
number of clients: 100
number of threads: 10
maximum number of tries: 1
duration: 300 s
number of transactions actually processed: 383777
number of failed transactions: 0 (0.000%)
latency average = 77.878 ms
latency stddev = 25.883 ms
initial connection time = 1109.539 ms
tps = 1283.107478 (without initial connection time)
Still about the same. So our benchmark must be more memory bound than disk or compute bound.
Before we get into more changes we should pause and talk about the artificial nature of any benchmark. This is a synthetic test that is designed to stress the database in a specific way. It is not necessarily representative of real-world workloads. In particular, it is not testing the performance of the database under load from our actual application. The access pattern of any application is going to be specific to it and if you’re looking to fine tune loads that’s the place to start.
The final stop was to switch to a Memory Optimized, E2ads_v5, 2 vCores, 16 GiB RAM, 32 GiB storage. And… it was about the same again.
transaction type: <builtin: TPC-B (sort of)>
scaling factor: 50
query mode: prepared
number of clients: 100
number of threads: 10
maximum number of tries: 1
duration: 300 s
number of transactions actually processed: 338824
number of failed transactions: 0 (0.000%)
latency average = 87.933 ms
latency stddev = 33.839 ms
initial connection time = 2141.106 ms
tps = 1135.947317 (without initial connection time)
So I have no idea what the limiting factor here is, network bandwidth maybe? I ran the benchmarks from a series of machines including ones in the Azure data center and always it ended up at the same place. Super weird.
Anyway the point here is that servers are pretty fast and if we keep the database local to the web server then the performance we’re going to get will be very much better than what we’re looking at within Azure for a significant cost savings. This is a pretty clear win for the VPS and a pretty clear indication that the cloud may not be the right choice for hosting databases for small to medium applications.