2013-02-05

Hotel Internet

I don’t spend a great deal of time traveling but when I do I become painfully aware that the Internet is not everything I expect it to be. I don’t mean that the Internet in America is necessarily worse than it is in Canada, although I feel it is better armed. What I mean is that access to internet outside of my home turf is expensive.

How expensive? Oh god, don’t ask. I had a bill for $80 for something like 4Mb I used in Australia last year. You know what? That’s fine. Phone companies are jerks, I’ve come to expect it. You can’t blame a mosquito for biting you, that’s just what they do.

I do, however, expect thing to be better when it comes to hotels. I’m already paying good money to stay there and charging for Internet seems outrageous. To provide Internet for an entire hotel is pretty much chump change. Let’s say that the hotel IT group isparticularlydim and all they do is buy a cable modem for each room and they pay retail for the cheapest high speed package available(more that sufficient). Well based on Shaw Cable’s pricing it would be about $50 a month. This works out to about 1% of the potential revenue from the hotel room each month.

1%.

That’s the worst case scenario with Internet provided the most expensive way possible. Buying in bulk probably reduced the cost by an order of magnitude.

Instead hotels charge insane amount for Internet. I’ve paid as much as $25 a night and $150/week. The prices are highway robbery. They have you trapped; there is no other way to get on line. This would have been okay a few years ago but now that we’re all addicted to the Internet hotels areeffectivelythe bully from Calvin and Hobbes(Moe) waving our stolen lunch money in front of us as we starve. It is meatloaf day too.

Oh I got your Internet, all rightOh I got your Internet, all right

What really gets my goat(my goat’s name is Arnold and he likes cupcakes) is that hotels never, ever advertise how much they charge for Internet. It appears nowhere on their website or their pamphlets. They sneak it up on you once you’re checked in. They know they have a captive audience and make the most of it. What are you going to do? Change hotels?

Well, actually, yes. I’m done with hotels which charge for Internet. Let the word go out that from this day forth I will never pay for hotel Internet again. If everybody else gets on board hotels are going to have no choice but to starting providing our life blood free of charge. Come join me in boycotting expensive hotel Internet.

2013-02-04

Why Did They Break My Indicator?

My wife got a new car a few weeks ago. It is a pretty nice thing and even has that Microsoft Sync thing, which I’ll talk about in a future blog(hint: I think it’s awesome). But where it falls down is the indicator.

A steering knobA steering knob with indicator stick

As you can tell I’m an artist. What you can’t tell from that picture is that I’m also a car expert. So much so that I know that the indicator thingy is known as an “Indicator Stick”. I’m basically the Senna of Calgary.

On every car I’ve ever driven the indicator works the same way. If you’re changing lanes or you don’t want the indicator to stay on you can hold it. If you want the indicator to stay on you push it a bit further and it clicks. When you straighten up the steering knob or “wheel” the indicator self cancels.

normal

Enter the new car: it is all high tech and now the indicator doesn’t stay in position when it clicks. It seems like a really minor thing but it has far reaching implications. When self-cancelation fails there is no clear action to take to cancel manually. Do you push it in the same direction you pushed it in before? Push it the other way? It isn’t clear. Turns out you push it in the opposite direction, that brings a whole new set of problems. When you turn right andimmediatelychange langes you now have to press the indicator up twice, the first time to cancel and then again to actually indicate left. To make matters worse the audio hint that the indicator is on is really quiet. More than once I’ve found myself being the guy who is always indicating.

Scott Hanselman would say that I’m upset because somebody moved my cheese. I am. I would be fine with the change if I felt it provided some advantage over the previous version. For the life of me I can’t think what the advantage is. This brings me to my point: if it ain’t broke don’t fix it.

I see a lot of websites and software tools which are changed driven by not a user need but by a programmer’s desire to improve things. There is nothing wrong with wanting to make things better but there needs to be some evidence that a change will be for the better. Metrics are your friend in these circumstances. If your user base is sufficiently large you can make use of A/B testingto refine your software over time. If your user base is too small for an effective A/B test then you need to revert to a more direct approach: interacting with your users. Take some time to bring the changes to your users and let them lead the evolution of your ideas.

All too frequently do we programmers believe that we’re the domain experts and that we now know better than our users.That is infrequently the case so it is worthwhile to always give users the opportunity to interact with development versions as they’re being created. We make use of hallway testing and frequent demos to avoid creating user interfaces which don’t help the user.

Your users have to know where their cheese is at all times and that if you move it on them it should be somewhere that is easier to find than where it was.

Oh, and if you’re driving behind a guy who is indicating all the time, sorry that could be me. It isn’t my fault, my cheese is missing.

2013-02-01

So Many Requests

I make use of wordpress.com for my blogging. I chose it because it was easy, andrelativelycheap. I could have created my ownWordpresssite on Azure or Amazon but it is actually far less economical ($99 a year vs. $570 a years for even the smallest Amazon instance). One really nice feature is that there is an awesome looking page which lists various statistics about your blog. I tell people I don’t care about how many people read the blog but, damn it, if watching that page isn’t addictive.

The page looks like this:

stats

I’ve been on a bit of a vacation for the last week and have had poor internet access and the page seems to take a long time to load. I cued up the network monitor in chrome to see why the page was taking so long to load. The results were shocking to me: the page required 122 server requests. That’s is anawfullot. When I build sites I’m pretty worried at 10 server trips. 10 server trips is a smell. 122 is stinky

Lawrence Limburger

Digging into these requests we find that 27 of the requests are JavaScript and another 10 of them are CSS. The majority of the reset are images, we’ll come to those later. Why is it a big deal that there are so many requests? Because there significant overhead to both performing DNS lookups and to opening up so many HTTP requests. You can only open a limited number of requests at a time so some of these many server trips happen in serial. It all adds up to slow page loads and a poor user experience.

The solution for the JavaScript and CSS is easy to implement: bundle the requests. A lot of work has gone on in the .net space to enable bundling of files. It has been a while since I’ve done work on a Linux stack but it looks like WordPress runs on Nginx as a webserver. As it turns out there is a concatenationmodule for Nginx. Why the heck isn’t wordpress, which is a major website serving files which are so unoptimized? I don’t know, perhaps a lack of craftmanship.

This is an easy win: a couple of hours work implementing a concatenation module saves eery one of your users time. Come one, WordPress. Let’s get with the program.

Now for images: combining images is actually pretty easy. You can make use of CSS sprites. Basically all the images on the page are combined into one image and then the client cuts them up into their appropriate sizes. This page is a bit problematic because a lot of the images are gravatars. Gravatar is a service which will transform e-mail addresses into avatars. It is used all over the place now days. The issue is that it only handles one image at a time. So if your page has 40 comments on it, and each comment has a gravatar you’re instantly at 40 server trips. If you’re serious about having gravatars on your site and still having a good user experience what I would suggest is that you build a gravatar proxy. This service would make the gravatar requests on the server side, bundle them as a single image and return it to the client which could split the image. With a bit of a caching policy on the server side you could really reduce the number of trips out to gravatar too.

With these improvements the page would load faster and I would be much happier. We’re talking about no more than a handful of hours work. Come on, wordpress, get with it.

Oh, and in answer to my wife’s question about who the guy in the purple suit is: he is Lawrence Limburger evil mastermind from the cartoon Biker Mice from Mars. There was a running gag that he smelled. You’re always going to learn something at this blog, although it might not be what you expect.

2013-01-31

Git and TFS, oh my

The huge news today was that the TFS team haveembracedgit to a crazy level. Theannouncementcan be read over at Brian Harry’s blog. I haven’t actually had a chance yet to use it but from what I can see git is a first class citizen in the TFS environment. Anything you could do with TFS source control you should be able to do now with git. This includes things like linking checkins to issues and sending git commits for code review.

At first glance that seems weird because what is TFS if it isn’t source control. Well TFS is a lot more than source control. People have watched TFS grow out of Visual Source Safe and have assumed that it is just a continuation of the source control only tool which was VSS. TFS is actually a whole ecosystem of tools related to the lifecycle of software. There are code review tools, issue management tools, backlog management tools. There is even a really sweet stakeholder feedback system which is aphenomenaltool that doesn’t get anywhere near the love it deserves. A couple of years ago I would never have said this but TFS is a pretty amazing tool. I actually have a draft blog post somewhere where I complained about TFS at length. Since I wrote it 2 years ago almost every one of mycomplaintshas been addressed. The only one outstanding after this git thing is around the use of WF in the build set up.

TFS is going to continue to have the TFVC source control engine available to you, should you want it. I’m not sure who is going to be using it or what advantages Microsoft see it having. In my mind TFVC is to the git backend as Silverlight is to HTML5. It is the 6th Sense of source control: dead but it doesn’t know it yet.

I’ve used a lot of source control systems over the years(CVS, Subversion, Perforce, Mercurial, VSS, Harvest, ClearCase,”¦(yikes, I’m old)) and I can honestly say that git is the best of them. However there is a pretty big learning curve with git and git certainly provides sufficient rope to hang yourself with enough left over to hang your extended family. I’m always cautious when one technology is adopted by all the players in a field as “the right way”. No problem with the complexity of source control can be fully solved and if you think it can then you don’t understand the problem.

My concern is that all the major source control players will start doing things the git way and we’ll become entrenched in thinking that it is the only solution. We’ll spend the next 10 years digging our way out of the hole just as we’ve done with IoC and ORMs.

I’m cautiously optimistic about the TFS approach to git. Git is better than TFVC but it doesn’t follow that git is better than all comers. Keep watching out for innovations in source control, it isn’t a solved problem.

2013-01-30

Fizz-Buzz Returns

On twitter today I was noticing that we’re getting back into a debate about fizz-bizz or fizz-buzz as a tool for hiring programmers. I blame a combination of Jimmy Bogart and Rob Conneryfor starting things up again. Funny how frequently Rob is to blame for things”¦

I love Fizz-Bizz as an interview tool. For those not familiar with it the idea is that you have the candidate write a very simple piece of code the requirements for which are something along the lines of

  1. For 100 cycles have the application print
  • Fizz if the cycle number is a multiple of 3
  • Bizz if the cycle number is a multiple of 5
  • The number otherwise

That’s it. The output should look something like

0
1
2
Fizz
4
Bizz
“¦

The question is a very easy one and most people should be able to write an answer very quickly. I let people write it on the whiteboard, I don’t care what language they use but they are time boxed at about 5 minutes.

Some people suggest that this is a form of gotcha interview questions. Meaning that either you come in knowing the answer already or you get lucky and figure it out. I disagree. This is super basic programming. The only tricky part is that it uses modularmathematics but honestly everybody learned that when they did division in grade 3 and had a remainder. Fizz-bizz is not gotcha interviewing as far as I’m concerned because it is exactly what you’re going to be doing in the job: figuring out problems and programming solutions.

Obviously fizz-bizz is not the end of your interview questions; answering fizz-bizz should not get you a job. It is the starting point and you use it to filter out the 10% or 15% of people who claim they can program but can’t actually. I’m just guessing at the percentages but I have wasted countless hours in interviews with people who really don’t understand the craft at all. If I can end the interview after 10 minutes instead of an hour then that is a huge time savings for me.

One incident sticks in my mind where I asked an interviewee to program a fibonacci sequence. In order to avoid it being a trap I explained, carefully, what a fibonacci sequence is and how to define it. We spend the next hour watching the poor thing flounder around trying to solve the problem. My mistake there was to allow the interview to go on for so long. We should have cut and run after 10 minutes.

The dirty secret about interviewing is that you’ve probably made the decision about hiring the person in the first 10 minutes anyway. First impressions are very important no matter how you try to avoid jumping to decisions. Cognitive biases of which we’re not even aware colour our impressions and lead us to seek evidencewhichsupports our initial conclusions. Fizz-bizz has the advantage of being a more empiricaltest than most interview questions. Asking it first, or after a phone interview is ideal. Bogart suggests that it can be done as a take home. I don’t like that because I think there is insight to be found in watching somebody complete the test.

During the test we watch out for thought processes and how smoothly the candidate abandons attempts which don’t work. It also gives advanced developers the opportunity to show off by using TDD or functional programming to develop the solution. I live for somebody asking me the fibonacci sequence question so I can break out the closed form of fibonacci.

Fizz-bizz is a useful filter for saving the interviewer time and it is an indicative tests. There may be times when you eliminate somebody who would have been a good candidate but I don’t think it is frequent. I highly recommend using fizz-bizz or a similar question in your interviews.

2013-01-29

HTML 5 Data Visualizations "“ Part 6 "“ Visual Jazz

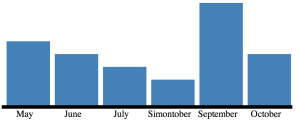
Note: I will be presenting a talk on data visualization in HTML5 on February the 14th at the Calgary .net user group. Keep an eye onhttp://www.dotnetcalgary.com/ for details. This blog is one in a series which will make up the talk I will be giving. I’m planning for this to be the finalinstillmentof this series. However, I’ve enjoyed playing with d3.js so much that I will very likely make visualization using it an ongoing theme on this blog. I’ve never considered myself much of an artist, as my poor school teachers can attest, but I do like this visualization design. In the last part of the series we figured out how to make a simple bar chart using d3.js. But this isn’t going to impress your boss because your boss read an article last week about HTML5 and how it is better than excel(I swear to you there are articles like this in “Boss Magazine” and “Pointy Hair Weekly”). The graph we made could have been created in excel so lets jazz it up a bit.

Animation

To start with let’s animation which is super simple with transitions. You can animate multiple properties and even add effect like bounce. Here is an example of loading the graph using transitions. I refreshed it a couple of times in the video because the effect is so cool. [wpvideo ZbF9usve] In this case all that was added was a couple of lines describing what to animate (the x attribute) and what effect to use (bounce). The added commands are there on lines 9-11. Transition tells d3 to animated from the previous value of at attribute to the new value. In this example we haven’t given any x value so the rectangles start off at the default x value of 0. Ease instructs d3 to use an effect, in this case the bounce effect. Finally duration tells 3d to make the animation take 750ms. Most properties can be animated. Here we have dropping and bouncing [wpvideo gjBv23aE] And this is my favorite: growing. In it you’ll notice that I had to set up a default value for y and transition both y and the height. That’s because 0,0 is in the top left and the bars would grow down, otherwise. [wpvideo R6FAvBoa]

Interaction

Animation are all very well and are great for leveraging the halo effectto ensure that people are enthusiastic about your application, but they aren’t all that useful overall.Fortunately, d3.js defines the ability to add event listeners to your visualizationpermitting interaction. When I first played with them I used them to change the colours on bars as of the graph as I hovered over them. In his D3 book “Interactive Data Visualization” Scott Murraypoints out that this effect can be better created using only CSS’ hover pseudo selector. That’s unfortunate because up until I read that section it was going to be my example. Instead let’s try adding extra information to the bar.

This ended up being way more complex than I had originally planned so let’s build it up nice and slow. The first thing is that we add some additional information to each of the month bars. Here we’ve added weekly percentages to each month.

We would like to divide the existing bars into bands when somebody mouses over them. To do this we can make use of the on() command. on takes two arguments, the first is the name of the event to bind, in most cases this will be mousover, mouseout or click. The second argument is a function to call when the event occurs.

#file-mouseover1-js-L9-L11 That's the easy part, the harder part is to come. We add to the current bar a number of additional bars

On line 2 in this code we set up a new scale which generates a different colour for each entry. D3.js comes with a couple of built in colour scales and here we’re using one with 10 colours. If this wasn’t a demo script I would make my scale derivative of the original bar colour. Line 3 is just a shortcut to the currently covered bar. Line 4 gets the top of the currently selected bar, this will be where we start adding new bars. Line 5 is where things get interesting, you may notice it looks somewhat familiar. In fact we’re using the same construct as earlier to define the bars. You’ll notice this select-data-enter quite frequently in d3. The only complex attribute is the y attribute which changes with each element as each element must start further down the bar.

All of this gets use something which looks like

[wpvideo mtzMgPaN]

There is a obvious flaw in this in that moving the mouse off the chart doesn’t remove the bars. To fix this we add a transparent rectangle over the top of the whole bar to detect when the mouse moves out. The original bar can’t be used as it will be covered which will cause the mouse out event to fire erratically.

Now it looks like

[wpvideo LobFZMpn]

Conclusion

We’ve only scratched the surface of the cool visualizations which can be created with d3.js. HTML5 visualizations are a great way to help people understand data. There is so much information available in the world today that it is almost impossible to understand it with out some sort of a visual aide. I’m going to continue blogging about data visualizations as I learn more about d3. You should learn along with me!

2013-01-28

this vs. _this in TypeScript

One of the real difficult things to deal with in JavaScript is understanding exactly to what the variable “this” currentlyrefers. “this” is a scope variable which means that it can change from line to line. In most languages this wouldn’t be a big deal because the number of scopes is small but with JavaScript so much is done with anonymous functions that things become confusing quickly.

In TypeScript many of these internal function can be replaced with what I would call lambdas but I believe might also be known as “Fat Arrow Functions”. These are taken directly from ECMAScript 6.0. However there is a key difference between the new lambda functions and the current function denoted functions: the value of “this”. In a fad arrow function the value of “this” is bound to the outer scope, the lexical scope.

So if you’re at all familiar with d3.js which I’ve been using a lot as of late the “on” function requires that “this” be permitted to be set by d3.

TypeScript forces this to be bound to the outer context by replacing our call to this with one to _this which is a new variable that TypeScript creates. Obviously this doesn’t work for our case as we expect this to be boud whatever d3 has found during selection.

There are a number of possible fixes on StackOverflow but they seem over complicated to me and some of them are jQuery specific. Instead I recommend simply using a traditional function instead of the fat arrow function.

2013-01-25

HTML 5 Data Visualizations - Part 5 - D3.js

Note: I will be presenting a talk on data visualization in HTML5 on February the 14th at the Calgary .net user group. Keep an eye onhttp://www.dotnetcalgary.com/ for details. This blog is one in a series which will make up the talk I will be giving.

Thus far we’ve made use of either pure SVG or made use of theRaphaëllibrary. Both were pretty simple but using a library certainly made things a bit easier and gave us access to more powerful programming tools. Now if you happent to have gone over to theRaphaël web site you might have seen some really impressive demos of drawing a tiger in SVGwhich just blows my mind. There are also a number of demos of graphs which are pretty impressive. HoweverRaphaël is a general purpose SVG library and isn’t designed specifically for making data visualizations. There is another library called d3.js which has been created for exactly our purpose. Cool.

Okay well let’s do the same thing we did earlier and rebuild our original graphing demo making use of d3.js.

Yay, giant block of code! To start with it looks like we’ve managed to get rid of a lot of the declarations which cluttered our function last time. d3.js has a bunch of utility functions which allow our code to be more terse. For instance we no longer need a our own function to find the maximum element in an array, d3.max will do that for us(line 21).

d3.js places a lot ofemphasison method chaining. If you want to set a number of attributes then you can just make multiple calls to attr. It is a clean way to programatically build up properties of the graph objects.

Lines 11 through 13 create an SVG element in the given container. You’ll notice that as soon as we create the element with append we can start adding attributes to it.

Next we set up a scaling factors.

d3.js has some great tools for setting up graph scales. Here we see two different examples. The first is using an ordinal scale, this means that we have a discrete set of input, or domain, elements. Our data contains a number of months and we map each one of those to something in a range. We map our domain to a rangeBand in this example. A range band is a continuious interval and the function will find a number of evenly spaced discrete values within that band to mark as output points. We also give it a padding of 10% to allow for spacing between our columns.

For the vertical, or y scale we use a simple linear scale taken from the domain of 0 through to the maximum value in the data set. For the range we use 0 through the maximum height of the bar which we set up earlier.

Here we are setting up the x axis labels by appending a new element to the graph and setting the properties.

Finally the actual bars of the graph are set up. Using data directive we set up the data used to drive our graph. Enter acts much like a map directive which calls the code that follows for each element of the data. This is where we use the various scaling functions we set up earlier.

The result?

Graphtastic!Graphtastic!

I really like the declarative syntax of d3 and I’m going to tie my horse to it for future data visualization projects.

2013-01-24

You Data isn't an Avocado

At my local supermarket you can buy avocados two different ways: either you get the individual avocados or you buy a bag of five avocados. The individual avocados are never ripe; they are as hard as a governess in a 19th century English novel. The bags of five are usually borderline overripe. This means that if you want to make anything with avocado the day you’re shopping you have to be prepared to eat five avocados in a single sitting. Now I like guacamoles as much as the next guy but five avocados is a hell of a lot.

I will have the enchilada platter with two tacos and no guacamolesI will have the enchilada platter with two tacos and no guacamoles

It is difficult to get just the right number and ripeness of avocados for my liking. Usually I have to buy a bunch of bulk avocados and wait rotate them out of the fridge one or two at a time so they’re not all ripe at the same time. A lot of application development is trying to get people data which is ripe. But you know what? Sometimes you can buy the data earlier and wait for it to ripen.

I don’t get it.

Yeah it isn’t the best analogy but I just ate 5 avocados worth of guacamole so I’m not all that coherent. What I’m getting at is that even though people tell you they absolutely need the latest data to make their decisions they don’t. I work in the oil and gas market and the majority of the people with whom I deal are the tree hating, printing reports type. If they are printing reports then they’re never going to have the latest data. The state of the system can change radically even from the time they hit print to the time they pick the paper up on the printer.

It is a bit of a change of mindset for developers to appreciate the fact that they don’t always have to query the database for information. Caching isn’t a new concept but typically it has only been used for expensive operations. What I suggest is that you should flip your mindset around caching from “cache when expensive” to “query when stale”. Cache everything.

There are some great tools and techniques out there for doing this at an application level. One of my favorite is to make use of an aspect weaver like Postsharp to wrap data queries. This allows you to write your code as normal but simply annotate the repository methods with an attribute which will cause the weaver to intercept the method invocation and pull the answer from the cache instead of from source.

The only obstacle to caching is knowing when to invalidate the cache and cause a requery. That is where I would suggest you spend your business analysis time. How frequently does data change? How much importance should be placed on having fresh data?If you happen to have an event log from an active system then it is pretty easy to calculate how frequently data changes.

Caching has a significant speed advantage and will allow your application to scale further with the same database. Databases are generally the key scalability bottlenecks in most systems and being able to delay difficult and expensive database rearchitecting or replacement is almost certain to pay off.

2013-01-23

Does var compile to the same code?

In a code review the other day the topic of when to use var and when to use a non-inferreddata-type. That’s a religious argument and probably a post for another day but the question of

Is there any difference between the code produced using var and using, say, string?

I confidently answered “No, it is identical. The type is inferred by the compiler and replaced”. But I was thinking about it later and I wondered if I was right.

I created a really simple test program

This code compiled down to

Changing the string to var produced exactly the same IL. So, oddly, I was right about something.