Simon Online

2021-11-24

Handling Nil in Nested Hashes in Ruby

Tony Hoare introduced Null in ALGOL W in 1965. He says that it was a billion dollar mistake. Fortunately, Ruby totally avoids this sticky problem by renaming null to nil. This is the same strategy that my kids use when I say “next person to ask for popcorn is going to do pushups” and they ask for “corn that has been popped”. If you’re navigating a nested hash, that is a hash that contains other hashes then you might get into a situation where you want to do something like

best_dessert = meals[:dinner][:dessert].find{ | dessert | {name: dessert.name, rating: dessert.rating } }.sort_by{ |a,b| b[:rating] }.first

There are a bunch of opportunities in there for nil to creep in. Maybe there are no dinners maybe no desserts… to handle these we can use a combination of dig (which searches a path in a hash and returns nil if the path doesn’t exist) and the safe navigation &. operator.

best_dessert = meals.dig(:dinner, :dessert)&.find{ | dessert | {name: dessert.name, rating: dessert.rating } }&.sort_by{ |a,b| b[:rating] }&.first

This combination of dig and &. allows us to get a nil out if nil appears anywhere in the chain without ending up in an error. We are calling the combination of dig and &. the 811 operator after https://call811.com/

2021-11-19

Choosing Power BI

If you’re a developer and you’re looking for a solution for reporting in your application then Power BI might be the right choice for you. However, there are tradeoffs that are worth considering before you dig in too much.

What is it?

The GitHub copilot I have running while writing this wants me to say that “Power BI is a platform for creating and managing data-driven reports. It’s a powerful tool that allows you to create reports that are easy to understand and use.” That sounds an awful lot like a sentence that an AI trained on Microsoft marketing data would say. It isn’t entirely inaccurate. For me Power BI is a combination for two different reporting tools which are pretty different from one another. The first is the one you see in all the marketing literature: Dashboard reports. These are nifty looking reports that are largely driven by visuals like maps or charts. Users can easily drill into aspects of the data by clicking on the charts or tables to filter the data and drill in. These reports aren’t great for people who like to see the underlying data and draw their own conclusions.

The second report type is Paginated Reports. These reports are basically a complete migration of the older SQL Server Reporting Services (SSRS) reports. There is limited support for cool graphics but if you need an Excel like view of the data then they are great. I’ve run into a few cases in the past where I’ve tried to convince users that they cannot possibly want a 90 page report and that they should use the dashboard report. But frequently users do legitimately want to print 90 pages and go at the report with a highlighter. One of my favorite sayings for these situations is that as a developer I make suggestions and users make decisions.

The desktop based tools for building these reports are all pretty good. The dashboard report tool in particular is excellent. It may be that your users don’t need to use online reporting and that providing them with a database connection and a copy of Power BI Desktop will be a good solution. The added advantage there is that the desktop tools are free to use. If you have a read only replica of your database then letting users develop their own reports doesn’t have much of a downside other than having to support people as they learn the system. A cool idea is to build projections or views inside your database to handle the complex joins in your data and remove that burden from the users.

If you want to embed the reports in your application there is facility for doing that through a JavaScript API. You do need to jump through some hoops to authenticate and generate tokens but that’s a lot easier than developing your own HTML based reports. There aren’t a whole lot of examples out there for how to do embeddeding and you will need to spend some time learning the security models.

The alternative to all this is to use one of the myriad of other reporting tools that are available. I’ve used Telerik Reporting quite a lot in the past and I can confidently say it is “not terrible”. That’s about as high of praise as you’re going to get from me for a reporting tool.

Cost

As with anything Microsoft the pricing for all this is convoluted and contently changing. This is my current understanding of it but you can likely get a better deal and understanding by talking to your sales representative.

  • Power BI Desktop: Free as in beer
  • Power BI Pro: Let’s you run dashboard reports online and embed them in your application (note that this doesn’t’ let you embed paginated reports) $9.99/month a users
  • Power BI Premium per user: This lets you run dashboard reports online and embed them in your application and also run paginated reports (note I didn’t say embed paginated reports) $20/month a user
  • Power BI Premium per capacity: Run and embed both report types. Open for as many users as you have. $4995/month. Yikes, that price sure jumps up

Being able to embed paginated reports was the killer feature for me that took the reporting cost from very reasonable to very expensive.

2021-11-14

App Services on VNET

When setting up an app service, including azure functions, you can have it reside on a vnet so it can access internal resources like a database. Often time though you’ll run into some problems routing to the database, specifically because of DNS. There are some good tools for debugging the connection.

First off you’ll need to open a console to the app service. I do this using the kudu tools but I think the console exposed directly on the portal works too. The standard tools can’t run in the restricted environment provided. However there are a couple of tools you can use in their place.

NSLookup - > nameresolver.exe - run it with nameresolver.exe blah.com
ping -> tcpping.exe - run it with tcpping.exe blah.com:80

If you’re seeing DNS issues you can override the DNS server with the variables WEBSITE_DNS_SERVER and WEBSITE_DNS_ALT_SERVER. These two are entered in the app service config settings

One of the most typical problems I’ve encountered is that the app service isn’t routing requests properly unless you add the app setting WEBSITE_VNET_ROUTE_ALL=1.

2021-10-25

Using ngrok for ASP.NET

If you try to just use ngrok like this

ngrok http 1316

You’re likely going to run into an issue when you browse to the website via the ngrok supplied URL that there are invalid host headers. This is because the local server is expecting headers for localhost and instead it is getting them for something like https://3fe1-198-53-125-218.ngrok.io. This can be solved by running with

ngrok http 1316 -host-header="localhost:1316"
2021-10-25

Reading a TSV file in Pandas

Pretty easy, just use the csv loader with a different record separator

data = pd.read_csv('work/data.tsv', sep='\t')

You can tell it explicitly to use the first column as the header

data = pd.read_csv('work/data.tsv', sep='\t', header=0)

I also found that it interpreted my first column as an index which I didn’t want (it offset all the columns by one)

data = pd.read_csv('work/data.tsv', sep='\t', header=0, index_col=False)
2021-10-22

Using RLS in Power BI Embedded

Power BI is a funny animal. On some levels it is a logical successor to SSRS but on other levels it is a totally different beast. One of the ways it differs greatly from SSRS is in handling parameters, especially secure parameters. When embedding an SSRS report you could specify the parameter value in a secure fashion and then now show the selector to end users.

In many cases there is a need to use row level security (RLS) to restrict the data that a user can see in Power BI. There are a myriad of ways to do this wrong and I think I’ve explored most of them over the last few days. There is also at least one way that works.

A tempting approach is to use a filter. These can be applied at render time in the browser by adding to the config when embedding the report.

const config = {
      visualName: '',
      type: 'report',
      accessToken: token, 
      embedUrl: token.embedUrl,
      tokenType: powerbi.models.TokenType.Embed,
      permissions: permissions,
      // 👇 filters
      filters: [
        {
          $schema: "http://powerbi.com/product/schema#basic",
          target: {
              table: "monthlyProducts",
              column: "userId"
          },
          operator: "In",
          values: ["stimms"]
        }
      ],
      // ☝️
      settings: {
        panes: {
          filters: {
            visible: true,
          },
          pageNavigation: {
            visible: true,
          },
        },
      },
    }

This class of parameter is fine for providing filters that can be updated later by the user. However, it should not be used for parameters that require some degree of security like a user name. These parameters are easily changed and, unless your parameter are in some way cryptographically secure there is a good chance you’re introducing a broken access control - #1 on the OWASP top 10.

Instead of this approach you can use the manage roles functionality in Power BI.

This functionality is designed to provide high level filters for data. A lot of the examples I see are for things like restricting a user in the East region from seeing the data of a user in the West region. This is done by assigning a role to that user when generating the embedding token. Then you’d set up a role for each region (see 1) and apply a filter expression to your tables so the only records with a region of East would show up.

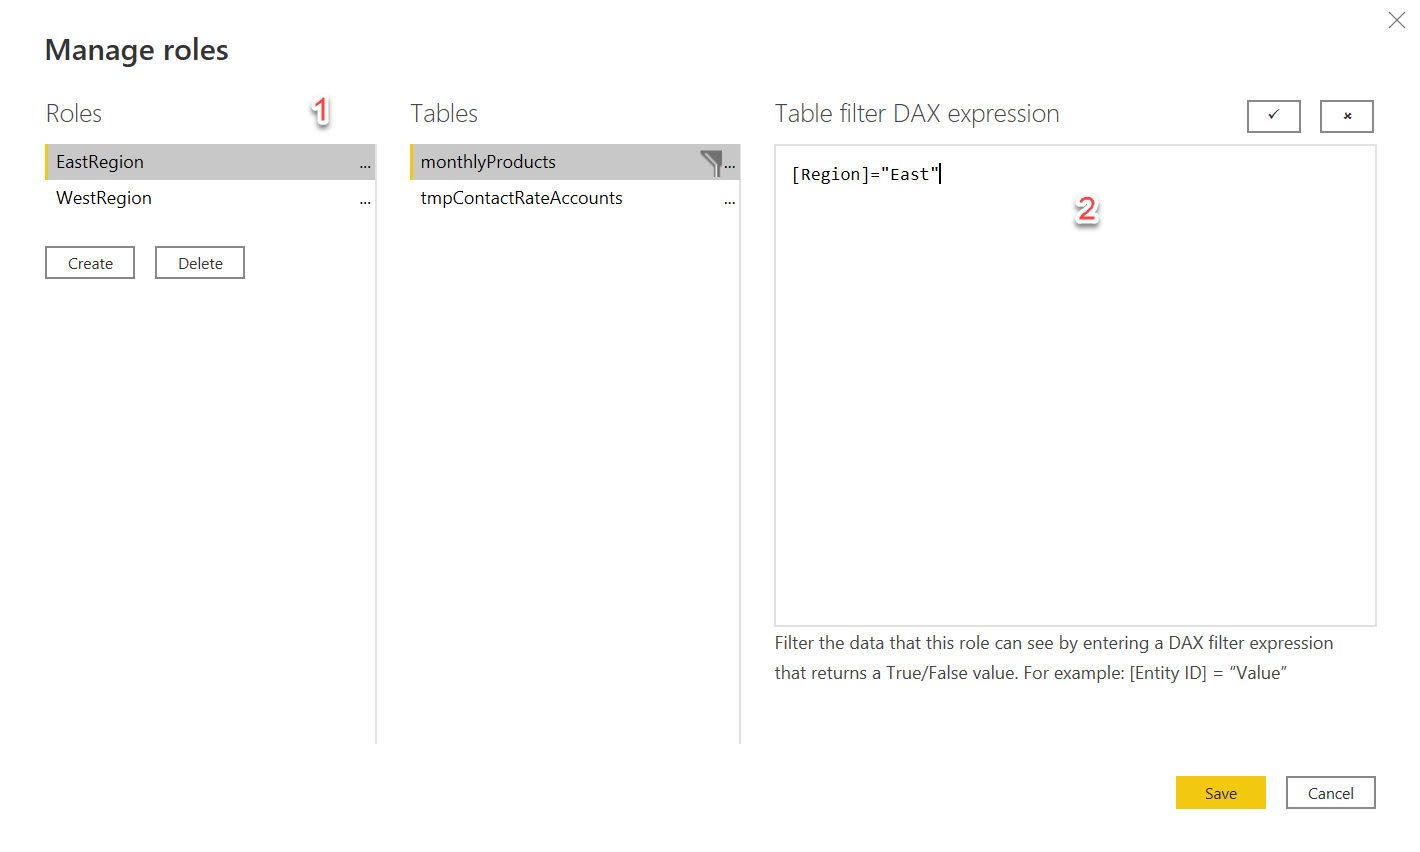
This is a simplistic and somewhat tiresome approach to adding a role mapping. What if a new region like SouthEast is introduced? What isn’t, perhaps, as clear is that DAX expression can contain dynamic functions like UserName() which make filtering more powerful. This UserName() will be bound to the effective identity passed in

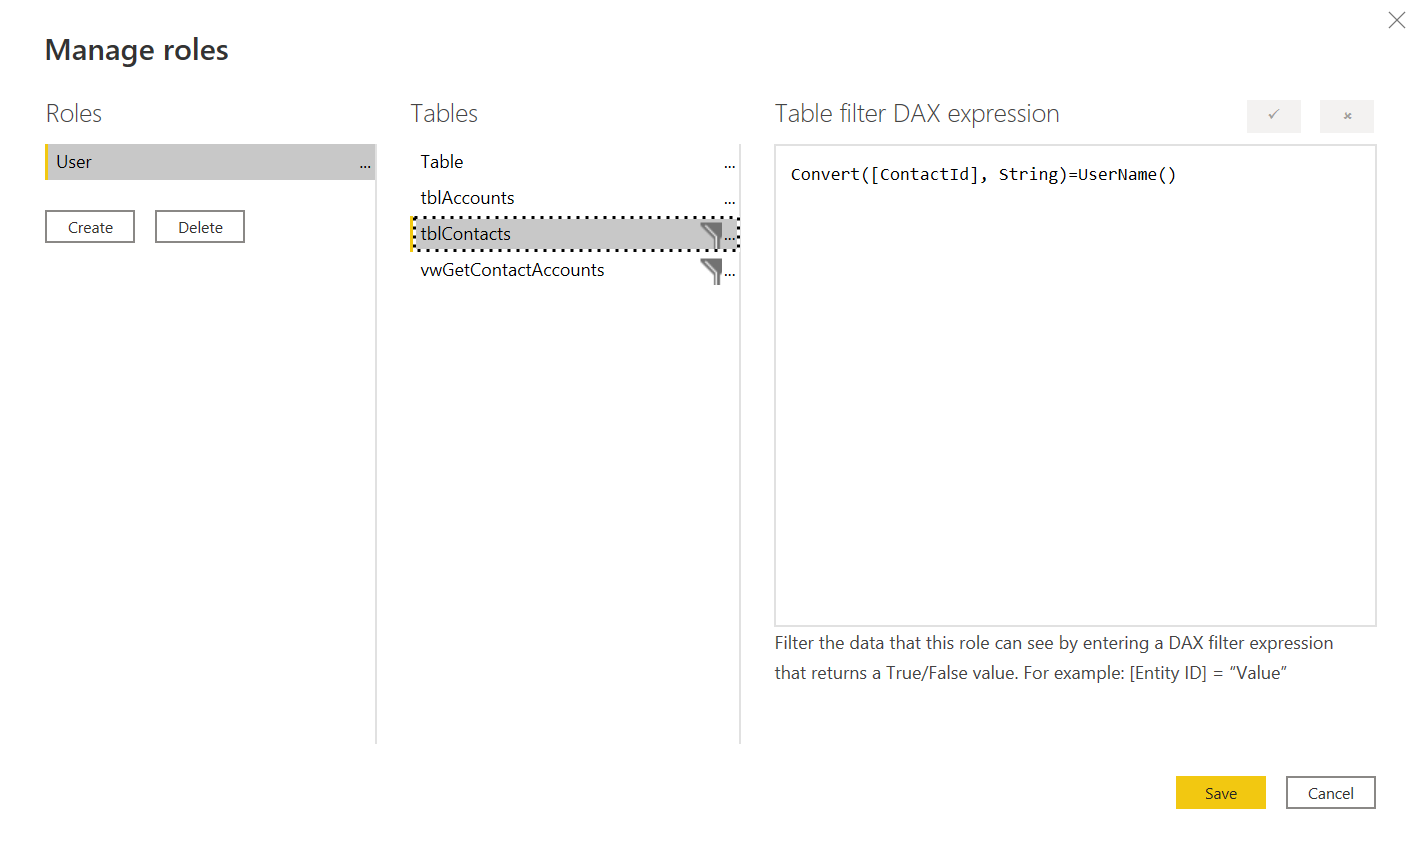
What I settled on for my filtering was to have a single role which I enforce at the embedded token generation level and then filter my data by the UserName() which I also set at the embedded token level. Because these are set at the embedded token generation time which occurs on the server I can be confident that I’m not providing a way for somebody to view data they shouldn’t.

The code for generation looks like this:

var tokenRequest = new GenerateTokenRequestV2(
                    reports: new List<GenerateTokenRequestV2Report>
                    {
                        new GenerateTokenRequestV2Report(reportId)
                    },
                    datasets: new List<GenerateTokenRequestV2Dataset> { new GenerateTokenRequestV2Dataset(report.DatasetId) },
                    identities: new List<EffectiveIdentity> { new EffectiveIdentity(user.ContactId.ToString(),
                                                                roles: new List<string> { "Users" },
                                                                datasets: new List<String>{report.DatasetId })
                    }
                );
var embedToken = await client.EmbedToken.GenerateTokenAsync(tokenRequest);

In this particular case the data I was returning from the database could be accessed by a number of different people depending on to which group they belonged. Initially I tried crossing the data against the user/group matrix but the cardinality of the resulting set was in the billions and totally overwhelmed both SQL Server and Power BI. Instead what I did was pull in the user/group matrix and the dataset that exposed the group id. In Power BI I did a merge of the datasets along with applying the row level filtering. This was necessary because, as far as I know, there is no way to pass the user name down to the actual query running against the server.

With all this in place I got good security and good performance. But, wow, did it take me a long time to get there.

2021-10-22

Mathplotlib cheat sheet

Part of an evolving cheat sheet

Include the library

import matplotlib.pyplot as plt

Set the plot size to be larger

plt.rcParams['figure.figsize'] = [30, 21]

Set plot title

plt.title("some title)

Plot a line chart

  plt.plot(filtered['datetime'], filtered['totalsales'], label="Sales Ingest")
  plt.show()

Add Legend

plt.legend()
2021-10-22

Pandas Cheat Sheet

Part of an evolving cheat sheet

Read a file

For CSV use

data = pd.read_csv('data.csv')

For excel use

df = pd.read_excel (r'./Detected as deleted from API data.xlsx')

You might need to install a library for xlsx files

pip install openpyxl

Get a summary of the data

Numerical summaries

data.describe()

Types of columns

data.dtypes

Create a new column from combining with another

This adds up values in two columns

data["totalqueuelength"] = data["Svc"] + data["Svc Que"]

This converts a couple of columns that have the data and time to a single field and turns it into a date

data["datetime"] = pd.to_datetime(data["Date"] + " " + data["Time"], format='%m/%d/%Y %I:%M %p')

Check date formats at https://docs.python.org/3/library/datetime.html#strftime-and-strptime-behavior

Create a new column from a function

df = df.assign(percent=lambda x: 100* x['deleted on date'] / x['total'])

Binning

You can bin the data by adding a new bin column to the dataframe

df['binning'] = pd.cut(df['percent'], 5) # 5 bins based on the percent column

Average a column

df['column'].mean()

Find row at an index

df.iloc[[int(totalRecords * .95)]] # Find the row at the 95th percentile

Filter data rows

data.loc[(data['datetime'] > '2021-10-16')]

Sort

df.sort_values(by=['percent'], ascending=False)
2021-10-12

Running Serverless Offline with a Self-Signed SSL Certificate

If you find yourself in need of running serverless locally using serverless offline and you want an SSL certificate then fear not, it’s not all that difficult. First you’ll need an SSL certificate. For our purposes you we’re going to use a self-signed certificate. This will cause browsers to complain but for local testing it isn’t typically a big problem.

Generate a Cert Using OpenSSL

You should install OpenSSL (or one of the more secure alternatives like LibreSSL) and then run

openssl req -newkey rsa:2048 -nodes -keyout key.pem -x509 -days 365 -out cert.pem

This will prompt you for a bunch of information about your organization. You can put anything you want in most of those fields but do pay attention to the Common Name field which needs to hold the value of localhost.

These are the answers I gave

Country Name (2 letter code) [AU]:US
State or Province Name (full name) [Some-State]:TX
Locality Name (eg, city) []:Austin
Organization Name (eg, company) [Internet Widgits Pty Ltd]:Inventive
Organizational Unit Name (eg, section) []:
Common Name (e.g. server FQDN or YOUR name) []:localhost
Email Address []:

You should now have a cert.perm and a key.pem in your local directory. Copy these into a cert folder at the root of your serverless project.

Running with the Certificate

Now you need to tell serverless where to find your certificate. You can either run with the flag

--httpsProtocol cert

or update your serverless.yml to include the cert directory

custom:
  serverless-offline:
    httpsProtocol: "cert"
    ...

Gotchas

If you’re seeing a warning about an invalid certificate then check that you’re accessing serverless via localhost and not 127.0.0.1 or 0.0.0.0. SSL works with domain names so you need to use one, even if it is just localhost.

2021-10-05

Configuration in Azure Isolated Functions

This is all done in the Program.cs. If you want to use the IOptions pattern which, let’s face it, everybody does. Then you can start with creating your configuration classes (I like more than one so config for different parts of the app remain logical distinct). These are POCOs

public class AuthConfiguration
{

    public string TenantId { get; set; }
    public string ClientId { get; set; }
    public string ClientSecret { get; set; }
    public string RedirectUrl { get; set; }
}

Then set this up in the host builder

var host = new HostBuilder()
            .ConfigureFunctionsWorkerDefaults()
            .ConfigureServices(container =>
            {
                container.AddOptions<AuthConfiguration>().Configure<IConfiguration>((settings, config) =>
                {
                    config.Bind(settings);
                });
            })
            .Build();

If this looks familiar it’s because it totally is! All of this uses the generic .NET host so this same sort of pattern should work in most .NET apps now.